Peak |
Q-type |
Chemical Shift |
Relative |
Peak Width |
Peak Shape |
Label |
(ppm) |
Peak Area |
(ppm) |
(x)L (1-x)G |
|
A | Q4(0Al) | -113.64 | 1.000 | 1.35 | 1.000 |
B | Q4(0Al) | -106.86 | 1.000 | 1.27 | 1.000 |
C | Q4(0Al) | -106.38 | 1.000 | 1.27 | 1.000 |
D | Q4(0Al) | -106.04 | 1.000 | 1.27 | 1.000 |
E | Q4(0Al) | -105.58 | 1.000 | 1.27 | 1.000 |
References
Spectrum
Crystal Structure
| Authors: | Rojas, A., Arteaga, O., Kahr, B., Camblor, M.A. | |
| Title: | Synthesis, structure, and optical activity of HPM-1, a pure silica chiral zeolite | |
| Reference: | J. Am. Chem. Soc., 135, 11975-11984 (2013) |
Digitization and Modeling of Spectrum
Spectrum information
| Obs. freq. | 79.49 MHz (Field = 9.4 Tesla) | |
| Pulse sequence | single pulse | |
| MAS frequency | 10 kHz | |
| Spectrum | Digitized and processed by Brouwer Lab, Redeemer University | |
| Data processing | Spectrum digitized with WebPlotDigitizer and deconvoluted with Mathematica notebook |
Chemical Formula
| |(ETMI+)6F6| [Si60O129]-STW ETMI+ = C8H15N2+= 2-ethyl-1,3,4-trimethylimidazol-1-ium (stick drawing) 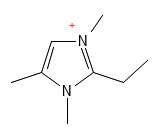 |
Downloads
| Download digitized spectrum in JCAMP-DX format (This file includes also the data listed on this page) | Download all lines from the above plot in .csv format (This file contains only the plotted data) |